What Is Charting?
When it comes to cryptocurrency and stocks, charting is the process of looking at charts to examine previous history and attempting to predict the future path of the price over time. As implied by the description, charting knowledge is an incredibly useful tool when it comes to purchasing or selling cryptocurrency. Charting can be easier than it seems, unlike those movies where you’ll see “day traders” doing crazy mathematical equations to predict stock prices.
Charting Software
In order to start charting, you’re gonna need an application to chart in. Here are a few web based applications I recommend for cryptocurrency.
- TradingView(my personal choice)
- CryptoWat.ch
- Coinigy
- GoCharting
The Chart
Before we begin going into trade patterns, let’s get to know what we’re looking at… The chart itself.

What Is A Chart?
The chart is and always will be the price of the currency(y axis) through time(x axis). Each bar(known as a candle) represents a unit of time. All of them together creates what we know of to be the chart.
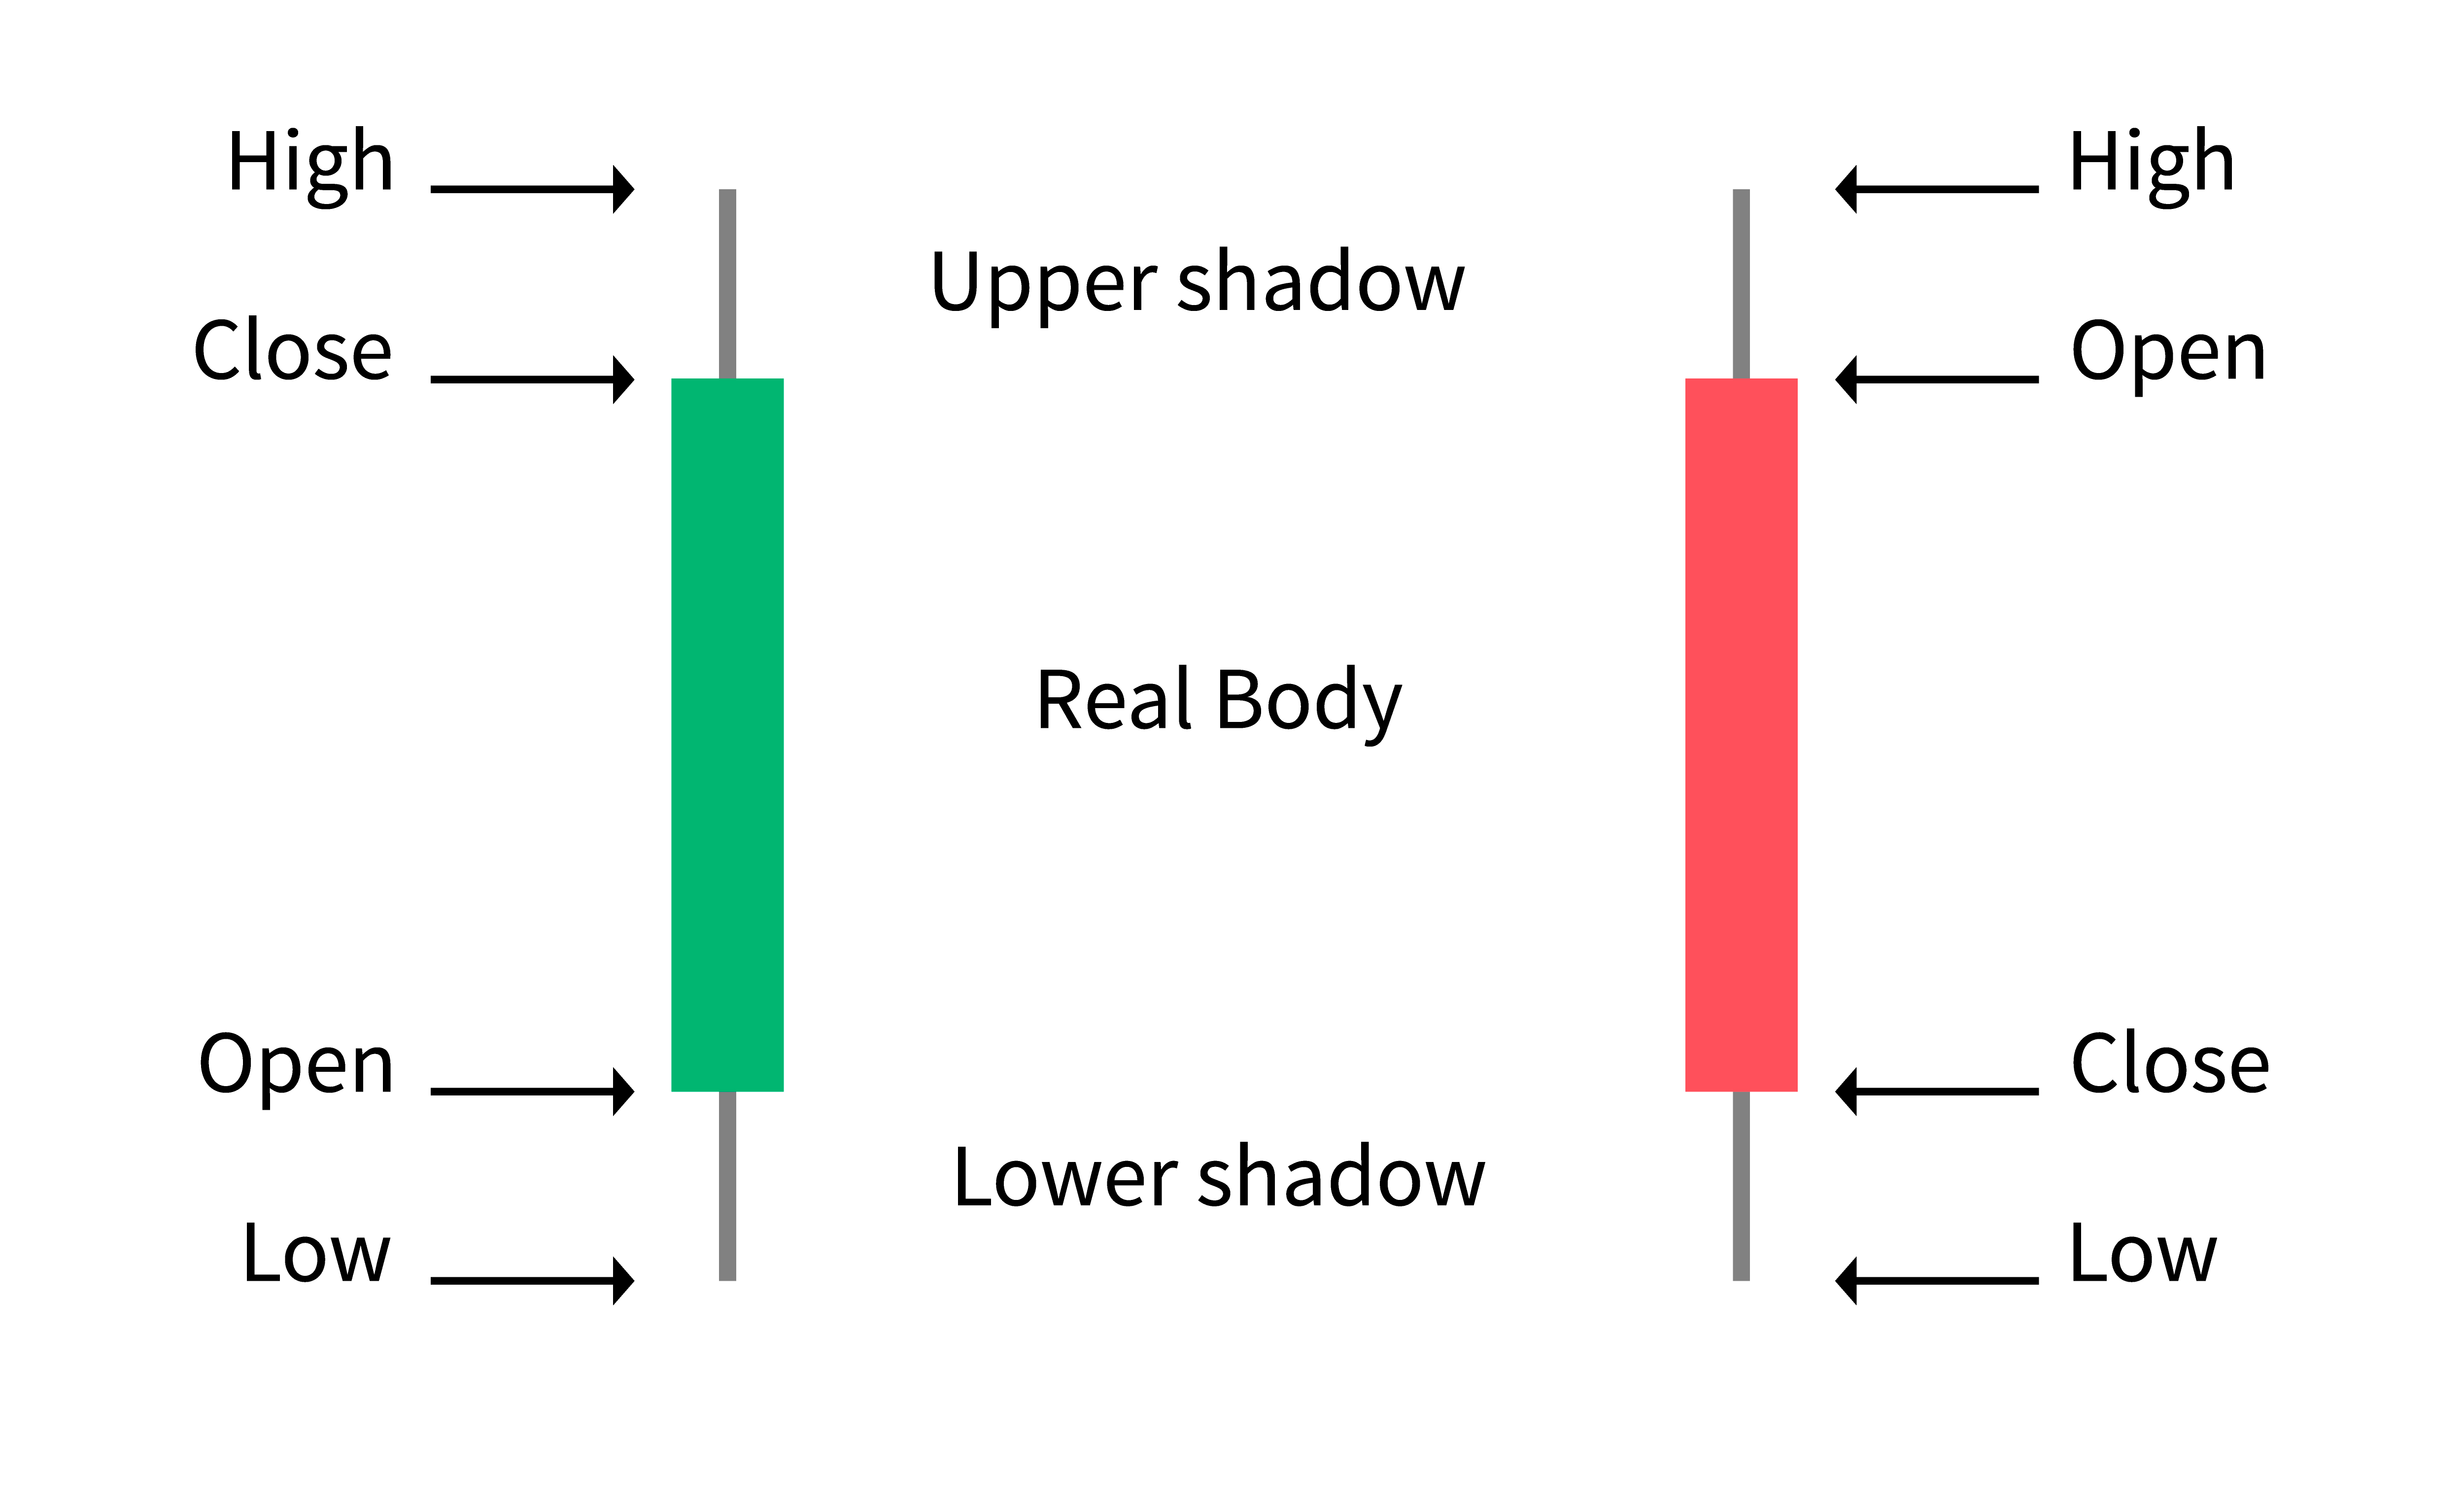
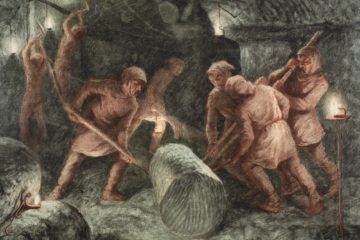
What Is A Candle?
A candle is used to represent the highest and lowest open+close price the currency has traded for within the predefined amount of time. The candle technical analysis strategy originated in Japan, during the 1600’s. Even though it’s old, it’s the most common way of looking at charts.
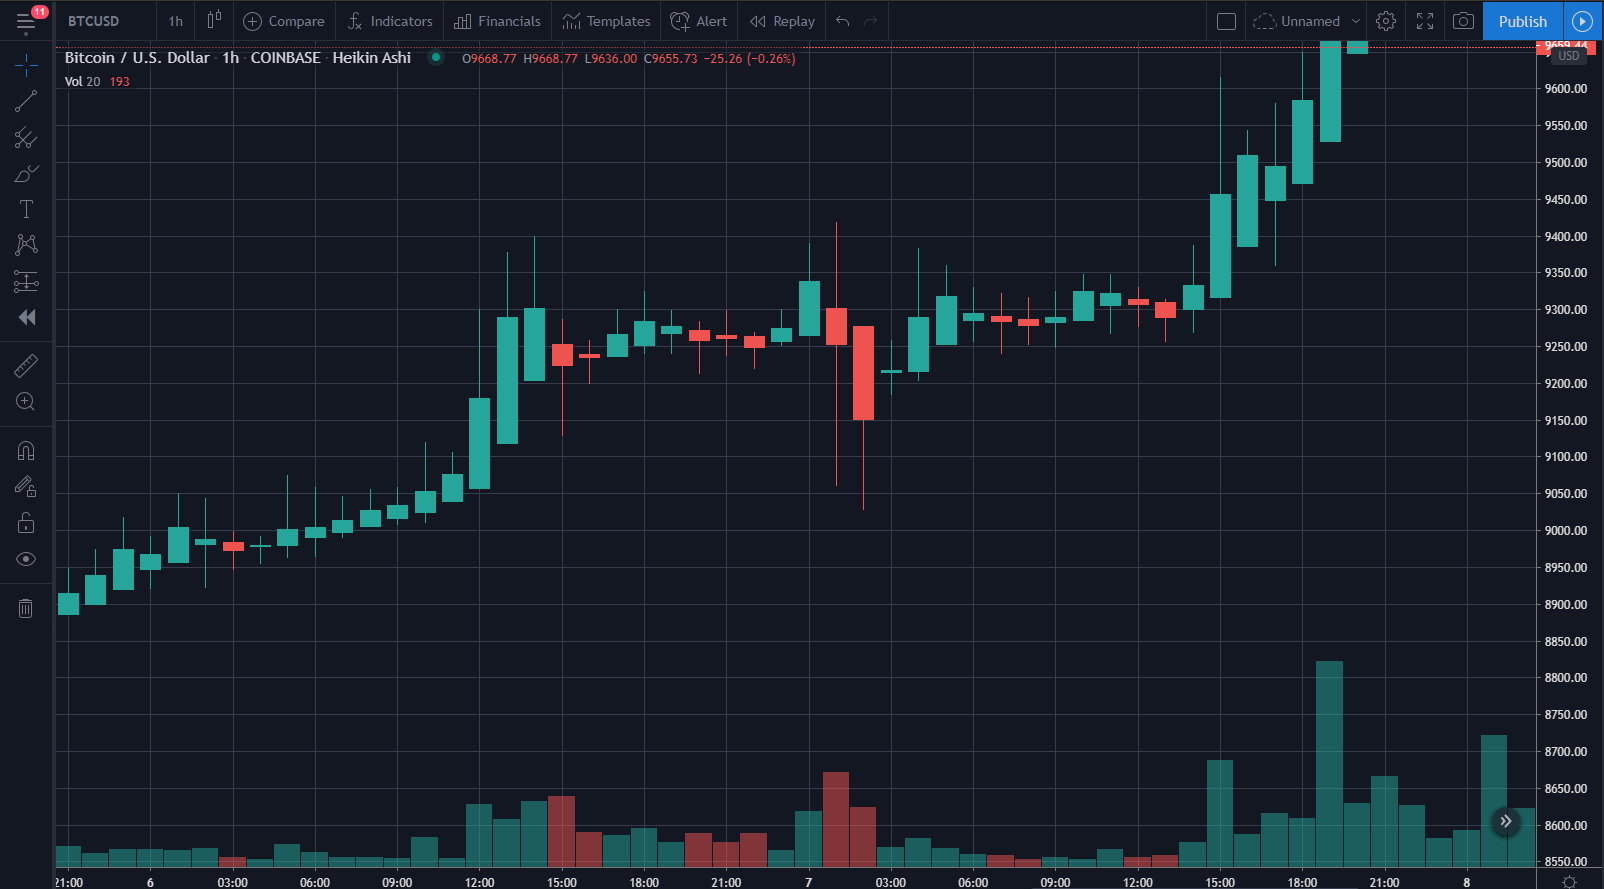
In the image above, you can see a few candles. In our case, each candle represents an hour of time(setting in the top left).
For more information regarding candles, I highly recommend this post.
Trading Patterns
The largest factor when it comes to predicting future price, is reading and understanding the current trade patterns. These patterns help indicate where the price is going next. While there are all sorts of patterns you can look for, below are what I believe to be the most common and beneficial for beginners to pick up on.
Support/Resistance Lines
Defining where the support/resistance lines are should be the first thing you do while beginning a new chart.
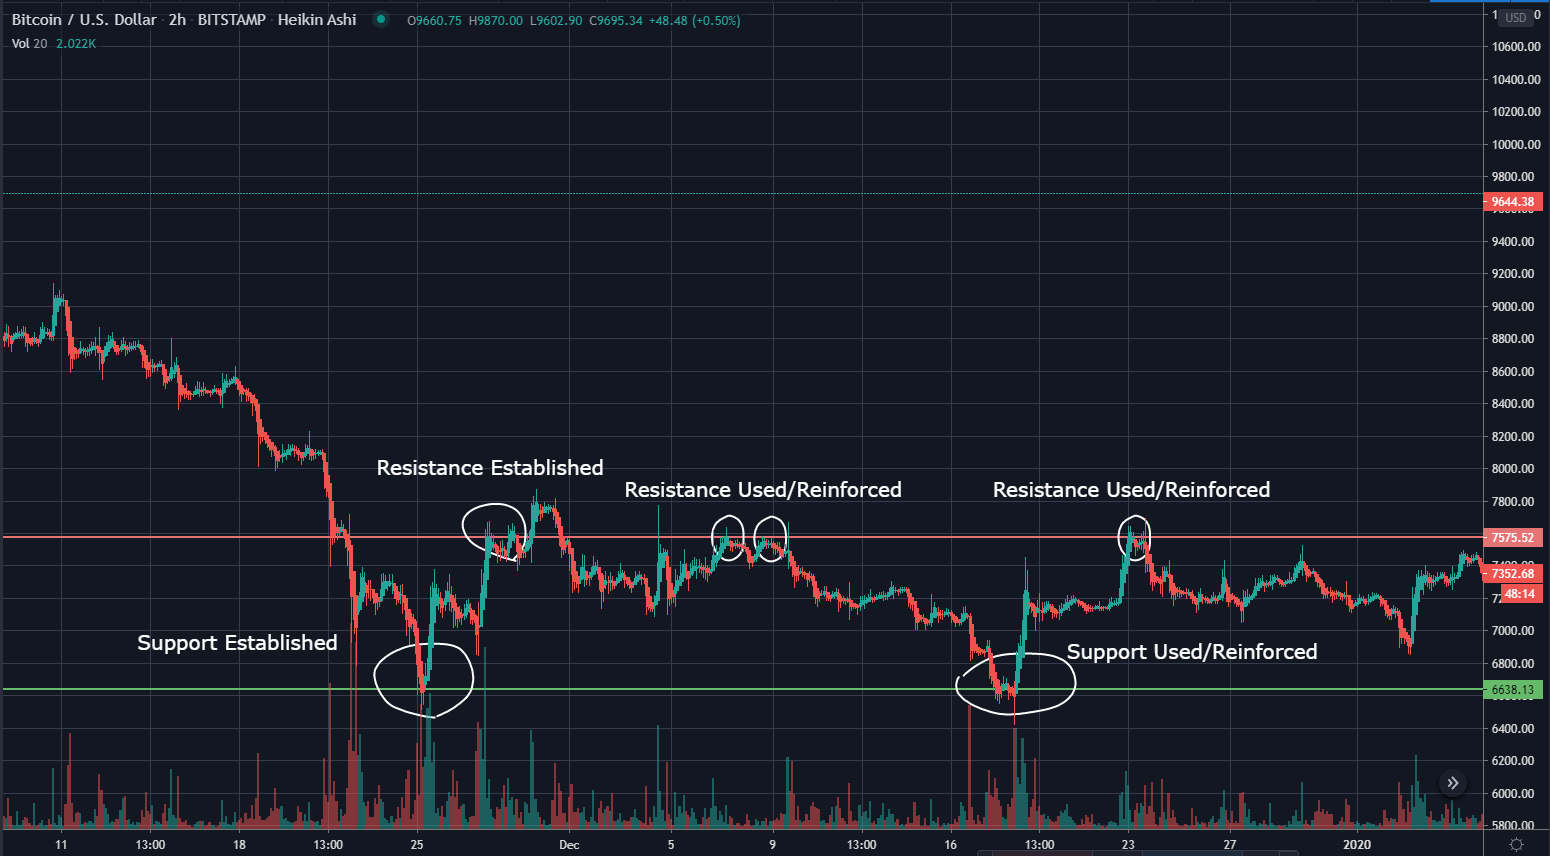
Support and resistance lines can be defined by points in which the price previously bounced and reversed direction. You can establish additional confidence in your lines by how many times they’ve been challenged and shown a struggle/failure to pass.
The Wedge
Charting wedges should be self explanatory. You look in the chart for a point in which you can draw a consistent two lines(following the highs and lows), to which they eventually collide.
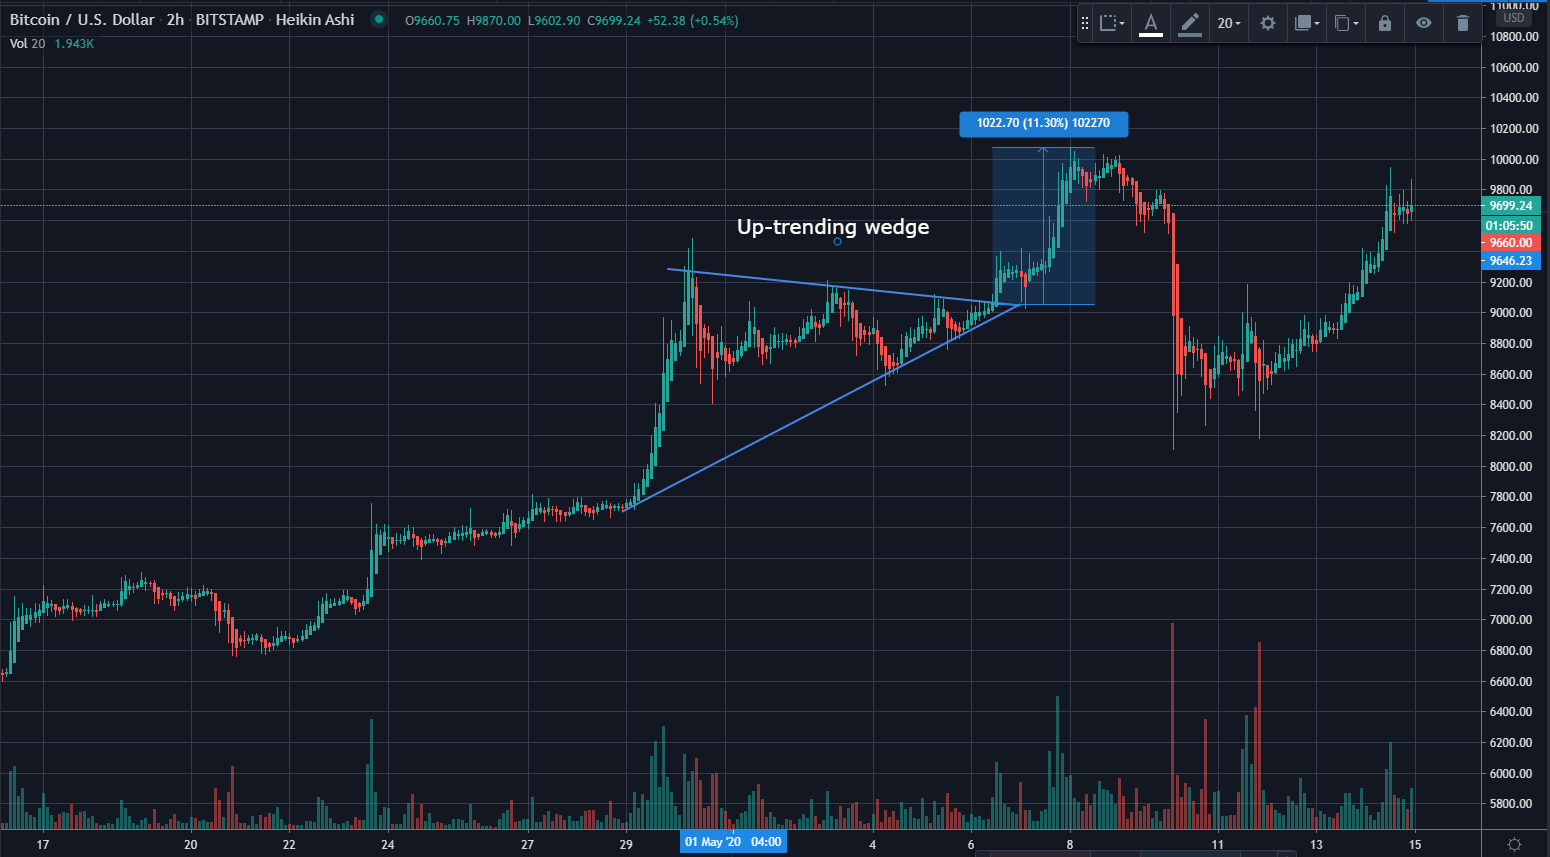
The more contact points the candles have with the two lines of the wedge, the more confidence you can have in it’s accuracy.
Wedges can indicate a rise, or a dump. You need to feel out the market and current trend to know which way it will go. They are a great sign used to indicate a potential trend reversal.
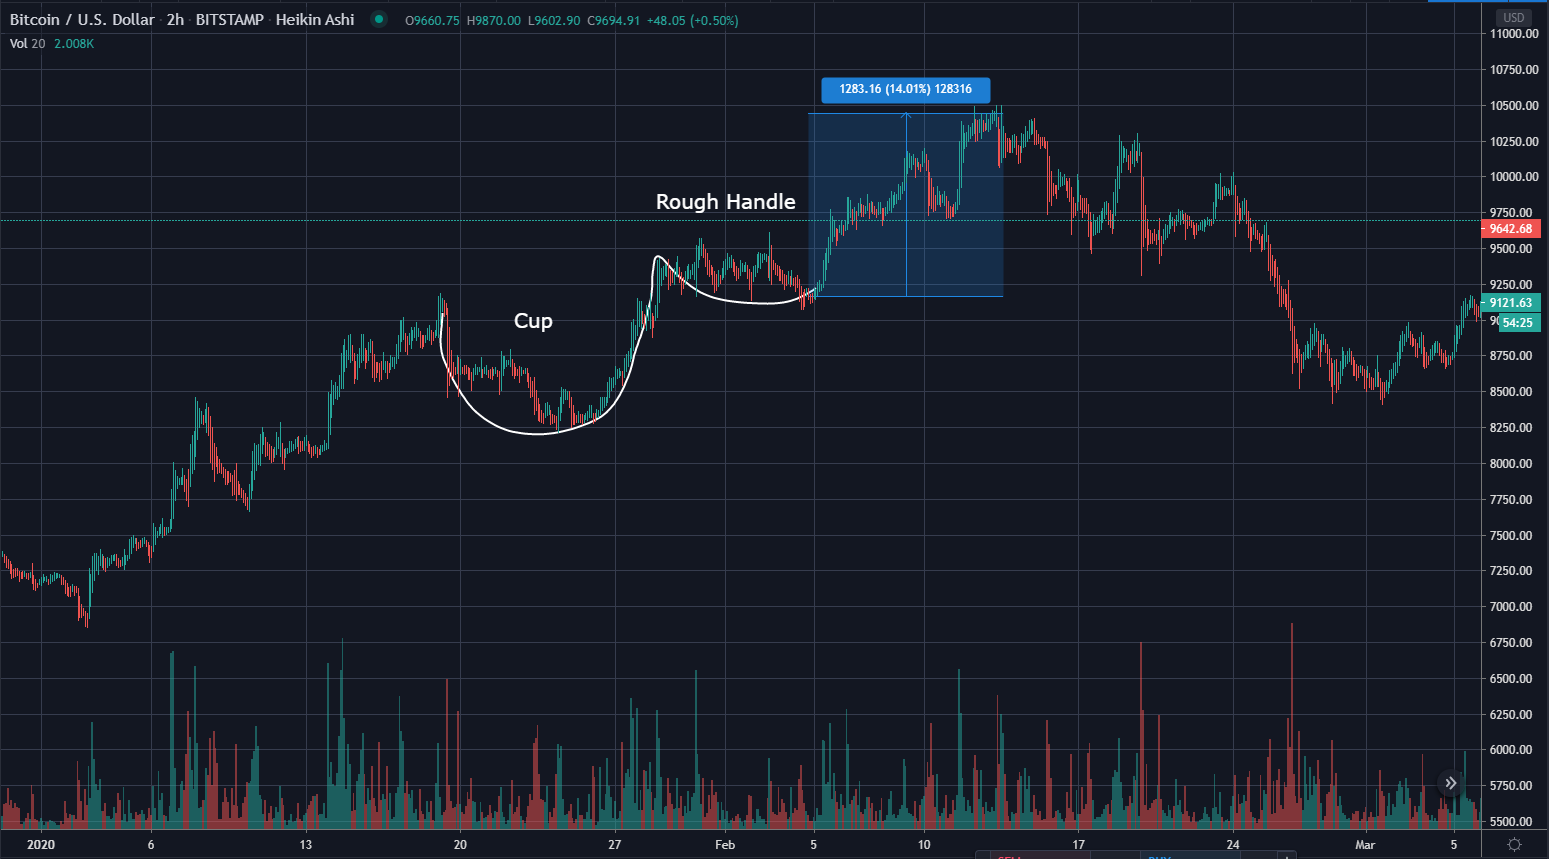
Cup And Handle
The cup and handle can be found by spotting a bowl shape, followed by a smaller one representing a handle.
This signal typically indicates bullish(buy hungry) behavior is on the way. A cup and handle in conjunction with a wedge is a man’s best friend.
The Flag
A flag, or inverse flag is used to predict future price after an immediate trend reversal.
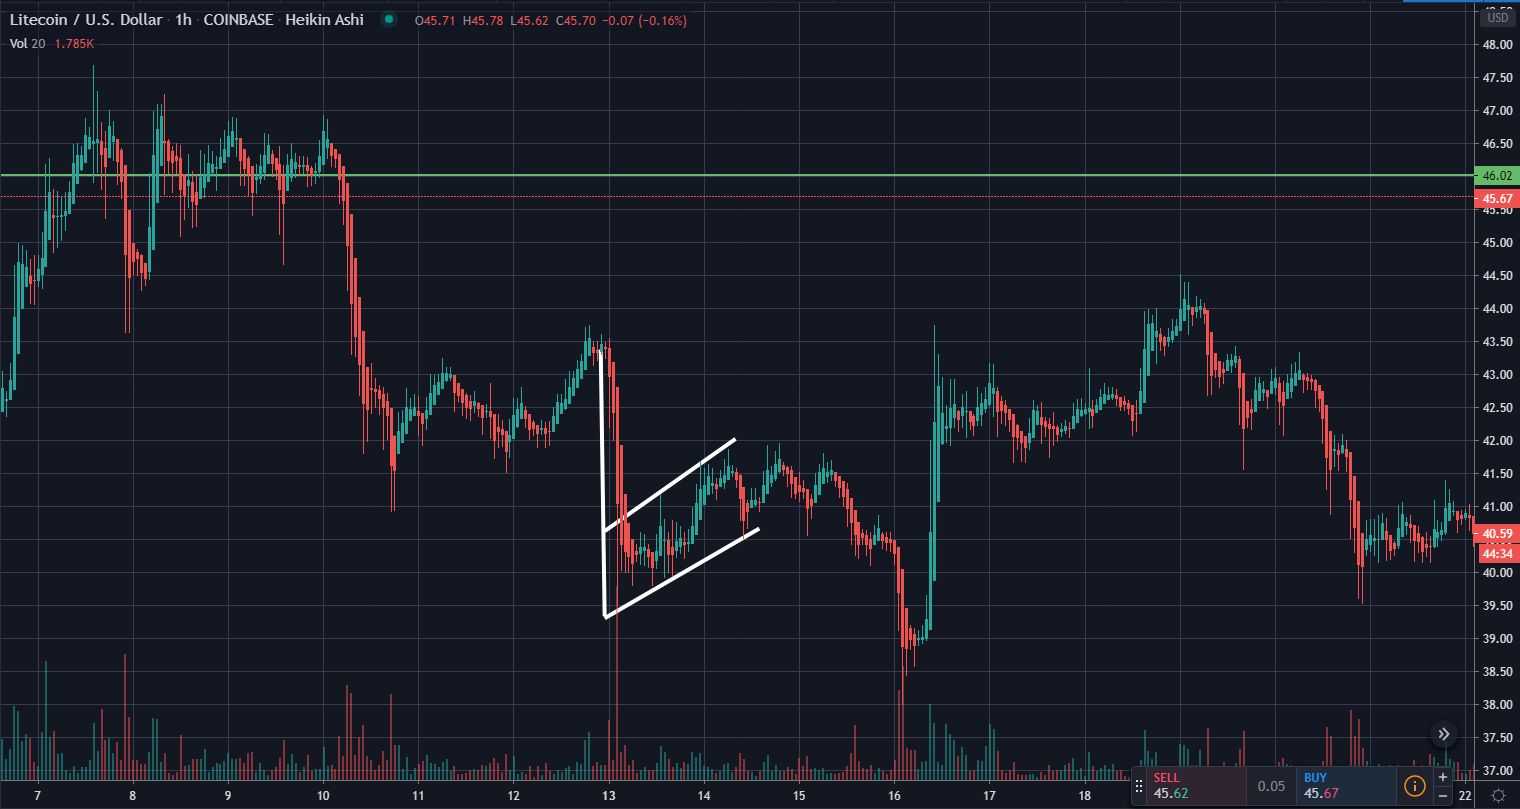
In the above image, you can see the flag pole, being the spike downward on this LTC(Litecoin) chart, and the flag itself being the the new temporary trend after the spike. The above image is actually what’s referred to as an inverse flag. Don’t worry! It works the same way the right-side up.
In Conclusion
You now know what a candle is, and some basic trading patterns if you didn’t before! Charting is like an art, you only get better with more practice and honing of you skills. For everyone getting into it, my first recommendation is to get into it! Don’t strictly base your actions on other peoples charts. Learn to look at a chart, create your lines/findings in it, and make your own predictions. Once you start feeling more confident in your predictions you can start putting your money where your mouth is.
In this article we went over only four different types of trading patterns, however keep in mind that there are an infinite amount of things you can look for. These are only what I consider to be the basic essentials.
Sources: Introduction to Technical Analysis for Beginners, Crypto Trading 101: A Beginner’s Guide to Candlesticks.


0 Comments